The U.S. housing market continues to present a complex picture, with recent data from ATTOM, a leading real estate data provider, revealing a slight uptick in foreclosure activity in the first quarter of 2024. While the numbers suggest a market in transition, there are nuances that paint a more detailed picture.
Foreclosure Filings on the Rise, But Below Pre-Pandemic Levels
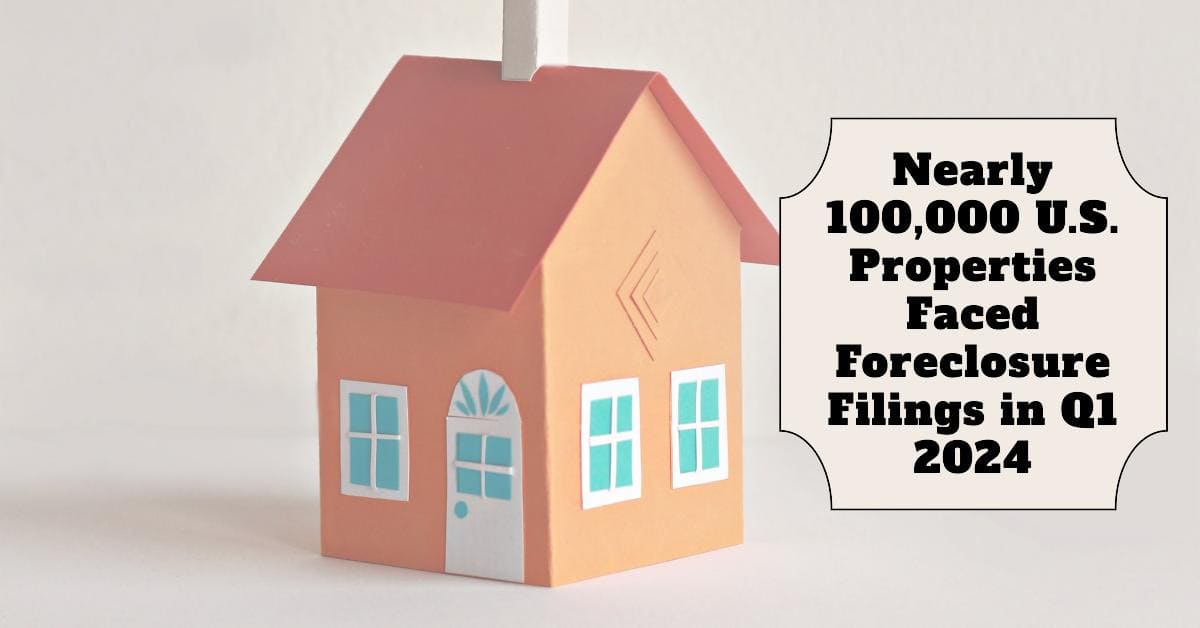
ATTOM's report indicates a 3% increase in total foreclosure filings compared to the previous quarter, bringing the number to 95,349 properties nationwide. This figure, however, remains slightly below those seen a year ago. Notably, March 2024 saw a slight decrease in filings compared to February, suggesting a potential stabilization.
“These trends showcase a market in flux,” explains Rob Barber, CEO at ATTOM. “Foreclosure activity is exhibiting modest growth, but it's important to remember that these numbers are significantly lower than pre-pandemic levels.”
Homeowner Equity Acting as a Buffer
A key factor contributing to the relative stability in foreclosures is the strong position many homeowners currently find themselves in. With home values remaining high, a significant portion of homeowners hold substantial equity in their properties. This financial cushion allows them to weather temporary hardships and avoid falling behind on mortgage payments.
Foreclosure Starts Show Localized Variations
While overall foreclosure filings remain subdued, the number of properties initiating the foreclosure process (foreclosure starts) presents a different picture. Q1 2024 saw a 2% increase in foreclosure starts compared to the previous quarter, and a 4% increase year-over-year. This suggests a potential uptick in future foreclosure activity, though the pace remains relatively modest.
It's worth noting that these increases are not evenly distributed across the country. Several states, including New Hampshire, Illinois, Florida, Rhode Island, and Nevada, witnessed significant quarterly jumps in foreclosure starts. Similarly, major metropolitan areas like New York City, Houston, Chicago, Los Angeles, and Miami saw a substantial number of properties starting the foreclosure process.
Foreclosure Rates by State and Metro Area
The data reveals a more concerning picture in some areas. Nationwide, one in every 1,478 housing units had a foreclosure filing in Q1 2024. However, rates varied significantly by location. Here's a breakdown of the states with the highest foreclosure rates:
- Delaware (one in every 894 housing units with a foreclosure filing)
- New Jersey (one in every 919 housing units)
- South Carolina (one in every 929 housing units)
- Nevada (one in every 961 housing units)
- Florida (one in every 973 housing units)
Major metros with at least 1 million people and ranking among the top 15 highest foreclosure rates nationwide include:
- Cleveland, Ohio (No. 5)
- Riverside, California (No. 9)
- Orlando, Florida (No. 10)
- Las Vegas, Nevada (No. 13)
- Jacksonville, Florida (No. 15)
Repossessions on the Rise, But Below Pre-Pandemic Levels
The report also highlights an increase in bank repossessions (REO properties). Lenders repossessed 10,052 U.S. properties through foreclosure in Q1 2024, up 7% from the previous quarter. However, this number remains 20% lower than what was seen a year ago. This suggests that while foreclosures are happening, they are not translating into a significant rise in bank-owned properties, potentially due to the strong housing market.
States with the highest number of REOs in Q1 2024 were Michigan, California, Pennsylvania, Illinois, and Texas.
Foreclosure Timelines Vary by State
The average time it takes to foreclose on a property also shows interesting variations. Properties foreclosed in Q1 2024 had been in the process for an average of 736 days, a slight increase from the previous quarter. However, this represents a 20% decrease year-over-year, continuing a downward trend observed since mid-2020. This could be due to streamlined foreclosure processes or a higher number of quicker resolutions outside of court.
States with the longest average foreclosure timelines include Louisiana, Hawaii, New York, Nevada, and Kentucky. Conversely, states with the shortest timelines include Montana, Virginia, Texas, Wyoming, and West Virginia.
Conclusion
The U.S. housing market continues to navigate a period of adjustment. Foreclosure activity is edging upward, but significant homeowner equity is acting as a buffer. Localized spikes in foreclosure starts and higher rates in certain states and metro areas warrant attention. The rise in bank repossessions, though modest, indicates a potential shift compared to the previous year. However, the overall lower foreclosure timelines suggest a more efficient foreclosure process.
Here's a quick summary of the key takeaways:
- Modest Increase: Foreclosure activity is showing slight growth, but remains well below pre-pandemic levels.
- Homeowner Equity as a Buffer: Strong home values are helping many homeowners avoid foreclosure.
- Localized Variations: Foreclosure starts and rates are higher in some states and metro areas compared to others.
- REOs on the Rise, But Not Soaring: Bank repossessions are increasing slightly, but remain lower than pre-pandemic levels.
- Faster Foreclosures: The average time to foreclose is decreasing, potentially due to streamlined processes.
Looking Forward
The U.S. housing market's future trajectory regarding foreclosures remains uncertain. Continued monitoring of these trends is crucial, particularly in areas with higher foreclosure activity. Factors like potential economic downturns or rising interest rates could impact homeowner finances and lead to a more substantial increase in foreclosures. However, the current strong housing market and homeowner equity position might continue to act as a buffer.


