Real estate is getting increasingly popular among investor groups. Investors bought more properties last year since home prices grew quickly and there were fewer homes for sale. They are eyeing growing prices because rental payments are also soaring, which encourages investors who want to rent out the houses they purchase. Many individuals who cannot locate a home to purchase are compelled to rent as a result of the housing supply constraint. In addition, investors who “flip” properties stand to make a substantial return as housing values increase.”
In the fourth quarter of the previous year, real estate investors acquired 18.4% of U.S. houses, according to Redfin. It was 12.6% a year ago and 17.4% in the third quarter. Although investor market share touched a record in the fourth quarter, the number of properties acquired by investors fell 9.1% from the third-quarter peak. In the fourth quarter, investors acquired 80,293 properties, up 43.9% year-over-year. Third-quarter investor house acquisitions were 75.3% cash. So, how are investors performing this year? Here's the summary of the latest Realtor.com® Investor Report for 2022.
Note: In their research, Realtor.com® analyzed deed data from January 2000 to April 2022 in 263 metro regions with more than 100 investor transactions in the year ending April 2022. They only considered single-family residences, condominiums, townhomes, and rowhomes, excluding multi-family buildings. They try to capture buy-and-hold investor purchases, excluding flippers. Some flipping activity is likely included as it is not always clear up-front whether an investor purchase is intended for a flip or buy-and-hold.
Investors Bought a Record-High Share of Houses in Spring of Last Year
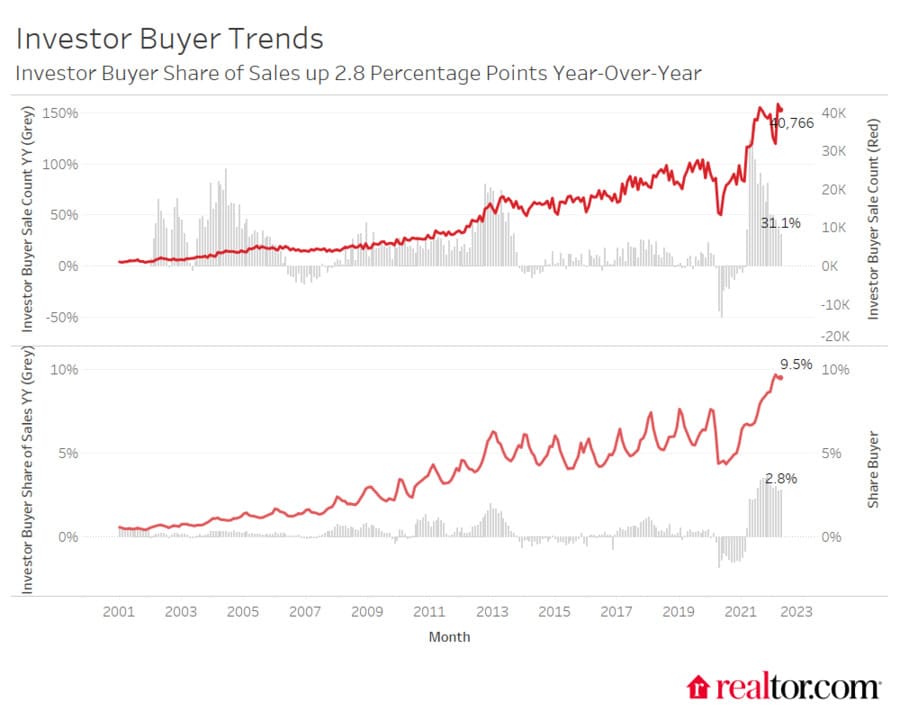
Realtor.com® defines an investor as a buyer or seller that was/is an absentee owner and that has a name that includes the following: LLP, LP, LLC, GP, or TRUST. According to their spring 2022 report, the investor proportion of house sales has declined significantly from its all-time peak in February 2022 but is about double its 2014/2015 level. After dropping in the early months of the pandemic, investors' proportion of house purchases has increased over the past two years, exceeding non-investors' growth and reaching a new high of 9.7 percent in February 2022.
Nonetheless, investor purchases have declined substantially in tandem with non-investor purchases since February 2022, bringing their entire buy percentage to 9.5%. However, the current proportion of investment purchasers is approximately double the proportion at the same stage in 2014/2015. In April, investors bought 9.5% of properties sold, up 2.8% from the same period last year but down from February's 9.7% peak.
After months of surpassing non-investor purchasers, investor behavior has paralleled non-investor behavior since February. 2021 investor house purchases surged 64% over 2020 when the COVID-19 outbreak hurt investor activity. 2021 purchasing was up 39% from 2019 before the epidemic. While investor purchases were down in January and February, they were up 31% in April and 64% over the same period in 2019, while total sales were down 8% and up just 7%.
Investors' percentage in house purchases is near record highs. In April, investors bought 9.5% of properties, down from 9.7% in February but up by 2.8% year-over-year. This high percentage is driven by both investor purchases and non-investor purchasers, who bought 11% fewer properties in April than a year earlier. The investor proportion of house purchases is almost double what it was in April 2015 (4.8%), but its growth pace has slowed compared to February after 19 straight months of increase.
Their data shows investor purchases under a corporate name. Cash purchases are overrepresented in the statistics because small investor activity under individual names isn't included. Pre-pandemic standards for investors buying properties with cash have changed. In September 2021, 78 percent of investors bought with cash, comparable to 2009 to 2015.
Larger investors with greater equity may have increased demand. Another is greater iBuying activity during this time. Since September, investors' cash purchases have fallen while mortgage purchases have risen. With borrowing rates so high, this pattern may alter in the coming months.
Larger Investors Grew Their Share of Purchases in 2021 to 35%
Despite the fact that smaller investors continue to acquire the highest proportion of properties among the group of investors we've found, bigger investors have overtaken smaller investors in terms of activity increase over the past year. Smaller investors, defined as those who have acquired 10 or fewer properties since their data collection began in 2001, accounted for 64 percent of investor-purchased homes in July 2020, just after the commencement of the COVID-19 epidemic.
Nevertheless, as housing demand surged and rents climbed over the last year, bigger investors, defined as those who have acquired more than 50 properties since 2001, raised their proportion of investment purchases from 18 percent in July 2020 to 42 percent in August 2021. Since August, demand from bigger investors has decreased to 32 percent in April, but their sales share has stabilized above historical norms, grabbing market share from both small and medium-sized investors.
Large home investor sale increase is attributable to Opendoor, Offerpad, and Zillow iBuyer activity (prior to their exit from iBuying). iBuyer's significant investor stake was 30% in 2021. In 2022's first four months, it was 22%. Large investor purchases fell from 32% to 27% in April when iBuyer data was removed. Among non-iBuyer big investors, demand peaked in August and has subsequently decelerated.
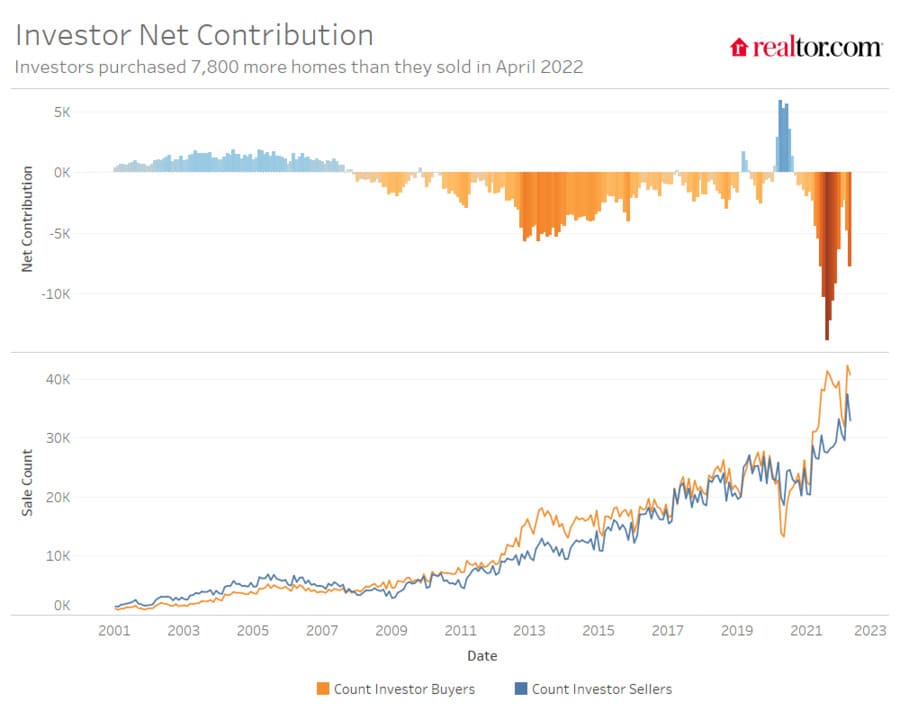
While investors are buying a record number of properties, the margin between their buying and selling has shrunk since August. August 2021 saw investors buying 14,000 more properties than selling. By 2022, the margin was 2,300 dwellings. While investor purchasing surpassed selling in March and April, investor selling is up 24 percent from April 2018 and 28 percent from April 2019.
Charlotte Saw Greatest Growth in Investor Interest
Southern metros saw the most investment activity last year, followed by the West. Larger investors raised their purchases more than medium or smaller investors in the South and West. Investors bought 20% of Charlotte-Concord-Gastonia properties in the year ending April 2022. Branson, MO (19.5%), Birmingham-Hoover, AL (18.9%), Summit Park, UT (18.6%), and Memphis, TN (18.5%) had the highest investment activity.
Three of the top five metros where investors bought the most homes were in the South, which experienced the most investor interest and the most increase over the last year. In eight of the top 10 metros, investors paid less than the median price in April 2022. Summit Park, UT, and Branson, MO were outliers. In these eight metros, investors bought properties for 16% less. The median investor purchase price was $295,000 in April, 15% less than the median selling price overall and 10% less than the median investor house sold. In all 10 areas, investors bought more houses than they sold in April, vying with purchasers for limited inventory.
Metro Average Investor Purchase Shares and Change in Shares
| Region | Average of 12 Months End April 2021 | Average of 12 Months End April 2022 | Average of yy percentage point change |
| Midwest | 5.9% | 7.6% | 1.7% |
| Northeast | 4.3% | 5.7% | 1.4% |
| South | 6.6% | 9.5% | 3.0% |
| West | 4.6% | 6.8% | 2.1% |
| Overall Average | 5.7% | 8.1% | 2.3% |
Not all major investor markets showed increased interest in the last year. Charlotte-Concord-Gastonia, NC-SC (+0.7%), Jacksonville, FL (+10.2%), and Birmingham-Hoover, AL (+8.8%) witnessed the most investor market share growth. Eight of the top 10 metros with the biggest growth in investor purchases over the past year are very cheap South metros with median list prices as or more reasonable than the typical home nationally.
The average April 2022 listing price in the top 10 metros where investors are rising was $372,000, compared to $450,000 nationally. Investors bought cheaper properties in all 10 markets. They bought properties 13 percent lower than April's median price. Except for Danville, VA, investors acquired more properties in April than they sold.
Source: https://www.realtor.com/research/investor-report-april-2022/
