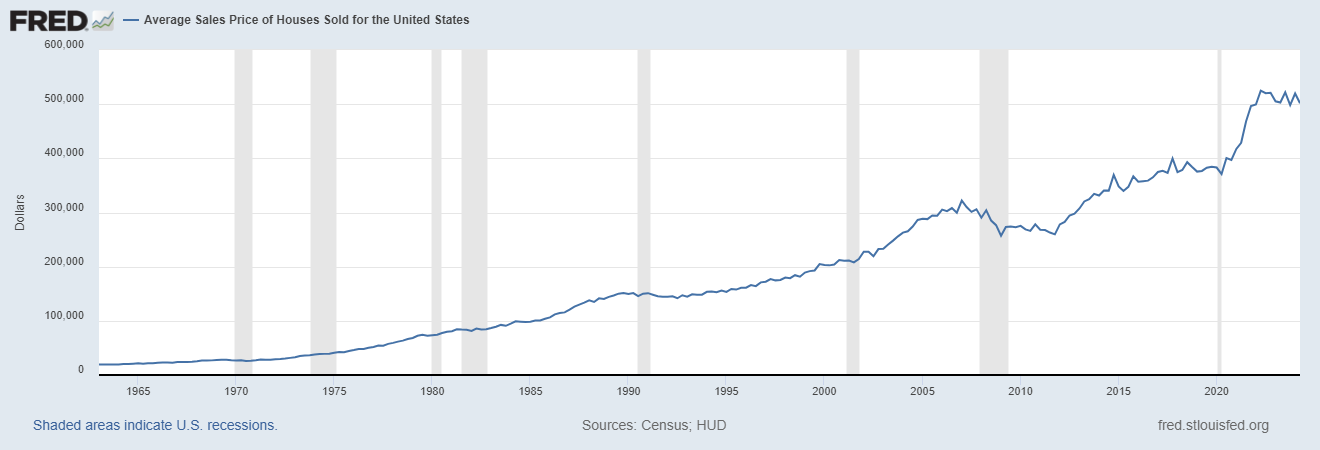
The housing market graph for 50 years is more than just a chart; it's a fascinating story about the American dream, economic booms and busts, and the ever-changing forces that shape where we live. From the humble beginnings of around $20,000 in the 1960s to the head-spinning figures exceeding half a million today, the journey of U.S. home prices has been anything but boring.
Think of it like this: your grandparents probably tell you stories about how cheap things were “back in their day.” Well, they weren't kidding, especially when it comes to houses! But before we dive into the hows and whys of this incredible journey, let's break down the data and see just how much things have changed.
Chart: U.S. Home Price Growth Over 50 Years: A Rollercoaster Ride

The Numbers Don't Lie: A Look at the Housing Market Graph (50 Years)
Thanks to the diligent data collection of the U.S. Census Bureau and the U.S. Department of Housing and Urban Development, we have a clear picture of how average house prices have evolved over the past five decades. This information, compiled by the Federal Reserve Bank of St. Louis, forms the backbone of our housing market graph (50 years) analysis:
- 1960s: The Era of Affordability – The average house price hovered around $20,000. Imagine buying a house with what some people spend on a new car today!
- 1970s: Inflation Hits Hard – Prices started to climb, reaching around $50,000 by the decade's end. This period saw high inflation, which affected the price of everything, including homes.
- 1980s: Steady Growth – The average price reached $100,000, a significant milestone. This was a time of relative economic stability and a growing middle class.
- 1990s: A Bit of a Lull – The housing market graph 50 years shows a slight plateau, with prices hovering around $150,000. The early '90s recession played a role in this.
- 2000s: The Boom and Bust – The early 2000s saw a dramatic surge in prices, peaking at an average of over $300,000 before the housing bubble burst in 2008, leading to a sharp decline.
- 2010s-Present: The Road to Recovery and Beyond – Prices have steadily recovered, exceeding pre-2008 peaks and recently reaching over $500,000.
What Drives the Housing Market: Unpacking the “Why” Behind the Graph
Looking at the housing market graph for 50 years, it's clear that home prices haven't just gone up in a straight line. There have been periods of rapid growth, stagnation, and even decline. So, what are the key factors that have shaped these trends?
1. Interest Rates: The Price of Money
Interest rates are like the volume knob for the housing market. When rates are low, borrowing money is cheaper, leading to increased demand for homes and, you guessed it, higher prices. Conversely, high-interest rates make mortgages more expensive, cooling down the market and potentially causing prices to drop or stabilize.
2. Economic Growth: Jobs, Wages, and Confidence
When the economy is booming, people feel more secure in their jobs and have more disposable income. This often translates to increased home buying, further fueling demand and pushing prices up. On the flip side, economic downturns can lead to job losses and financial uncertainty, making people hesitant to buy homes and potentially causing a decline in prices.
3. Supply and Demand: The Never-Ending Tug-of-War
The fundamental principle of economics—supply and demand—plays a crucial role in the housing market. When there are more buyers than sellers (high demand, low supply), prices tend to rise. Conversely, when there are more sellers than buyers (low demand, high supply), prices may fall or stagnate.
4. Demographics: The People Factor
Population growth, migration patterns, and even the age distribution of a population can impact the housing market. For example, a surge in young adults entering the housing market can lead to increased demand, while an aging population might result in more homes being put up for sale.
5. Government Policies: A Helping Hand or a Heavy Hand?
Government policies, such as tax incentives for homebuyers or regulations on lending practices, can have a significant impact on the housing market. These policies can be implemented to encourage homeownership, stabilize prices, or address other economic concerns.
Lessons from the Past, Insights for the Future
The housing market graph (50 years) provides valuable lessons about the cyclical nature of real estate.
- What goes up doesn't always go up forever. The housing bubble of the 2000s is a stark reminder that unsustainable growth can lead to painful corrections.
- Multiple factors are always at play. Understanding the interplay of interest rates, economic conditions, and other factors is crucial for making informed decisions about buying or selling a home.
- The market is always evolving. New trends, technologies, and societal shifts will continue to shape the housing market in unpredictable ways.
The Future of Housing: What Lies Ahead?
Predicting the future of the housing market is no easy task. However, by analyzing current trends and considering potential economic and societal shifts, we can make some educated guesses:
- Affordability Concerns: As prices continue to rise faster than wages in many areas, affordability will likely remain a major concern. This could lead to increased demand for smaller homes, more people renting for longer periods, and a greater focus on affordable housing solutions.
- The Rise of Technology: Technology is transforming how we buy, sell, and even experience homes. From virtual tours to online real estate platforms, technology is likely to play an even more prominent role in the future of the housing market.
- Changing Demographics: The aging of the Baby Boomer generation, coupled with shifting migration patterns, could impact housing demand in different regions.
In Conclusion
The housing market graph (50 years) is a testament to the dynamic nature of real estate. Understanding the factors that have shaped the market over the past five decades can provide valuable insights for both homebuyers and sellers as they navigate the ever-evolving world of real estate. While predicting the future of housing is an impossible task, one thing is certain: the journey will continue to be full of twists, turns, and perhaps even a few surprises along the way.
Related Articles:
- San Diego Housing Market Graph 50 Years: Analysis and Trends
- Average Housing Prices by Year in the United States
- Average Home Value Increase Per Year, 5 Years, 10 Years
- How Much Did Housing Prices Drop in 2008?
- Housing Market Crash 2008 Explained: Causes and Effects
- Housing Market Predictions for Next 5 Years: 2025 to 2029
- Housing Market Predictions for Next Year: Prices to Rise by 4.4%
- Housing Market Predictions for the Next 4 Years: 2024 to 2028


