As we look toward the future, experts predict a significant evolution in the housing market, particularly regarding home prices. The latest insights from Fannie Mae's Home Price Expectations Survey (HPES) reveal an intriguing market for homeowners and investors alike. This survey, which consolidates projections from over 100 housing experts, forecasts home price changes from 2025 to 2028, offering a crucial glimpse into what we can anticipate in the coming years.
This quarter's survey highlights some interesting trends and forecasts, especially concerning home price growth and the impact of potential policy changes on housing supply. Let's delve into the latest predictions and explore what the experts anticipate for the housing market from 2025 through 2028.
U.S. Home Price Projections for Next 4 Years: 2025 to 2028
The expert panel, consisting of over 100 individuals across the housing and mortgage industry and academia, anticipates a slower pace of home price growth in the coming years. While we saw a solid 6.0% growth in 2023, the predictions for 2024 and 2025 are 4.7% and 3.1%, respectively.
This slowdown is something that's been on the minds of many in the industry, and it's reflected in the data presented in the Fannie Mae charts.
Looking at the first chart, which shows U.S. Home Price Expectations from Q3 2024 through Q4 2028, we can see a couple of key things. First, the actual prices, as shown by the black line, have been on a fairly consistent upward trend since the start of the data in 1975. The line starts relatively flat, then experiences sharper growth in the 2000s, dips with the market crash, and then resumes a slightly more muted but upward trajectory.
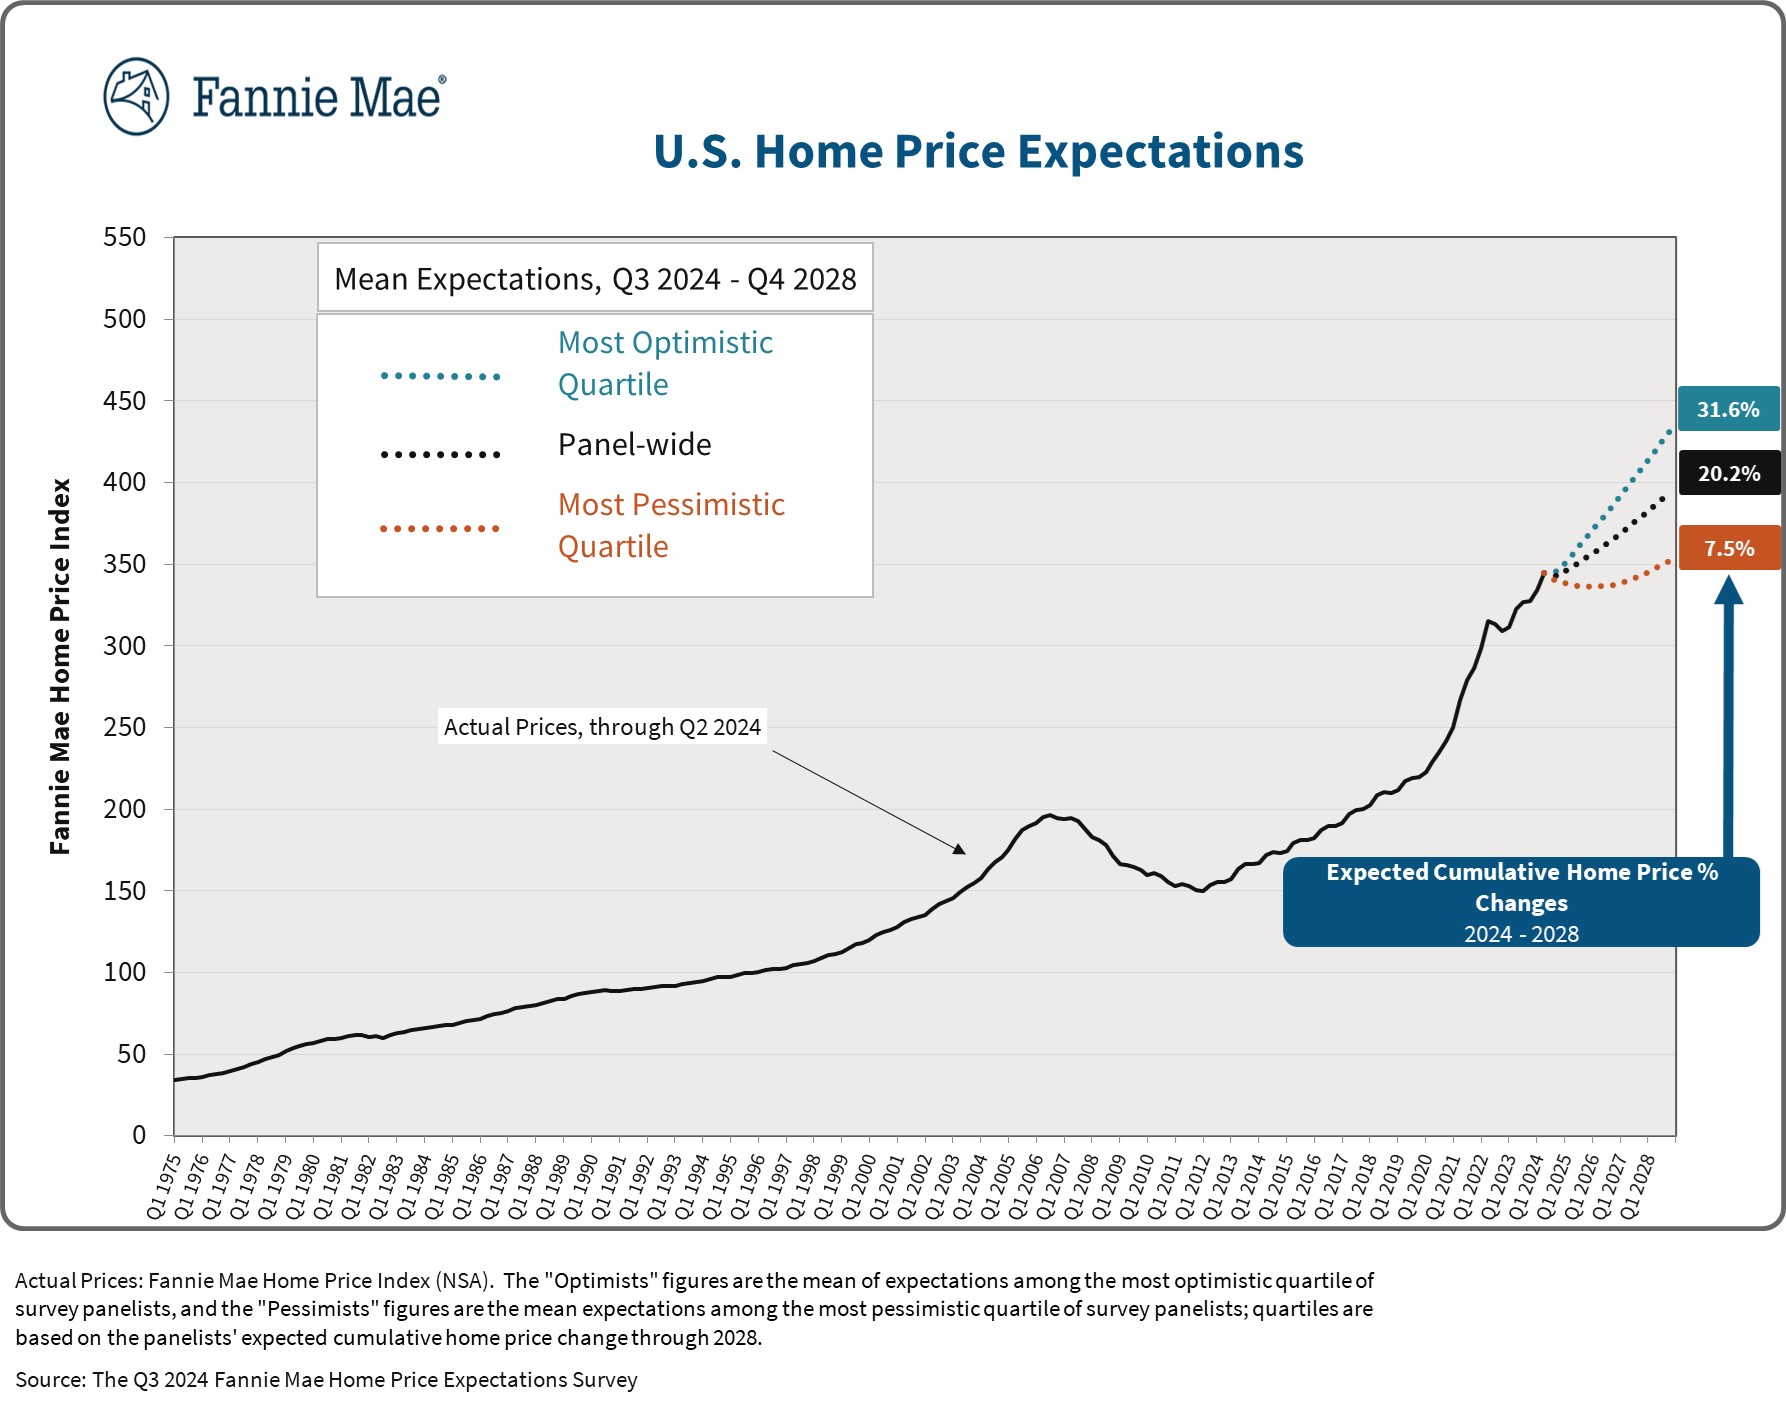
The most optimistic panel (in teal) shows that the experts believe home prices will continue to rise throughout the forecast period, ultimately culminating in a 31.6% cumulative gain by the end of 2028. The panel-wide median (in black) suggests a more moderate growth of 20.2%. And the most pessimistic panel (in orange) suggests a lower cumulative gain of 7.5%.
Yearly Breakdown of Projected Home Price Forecast (2023-2028)
The second chart, which shows U.S. Home Price Scenarios projected cumulative value changes by year, really highlights the difference in perspective among these experts. It shows how the forecasts for the optimistic, pessimistic, and all panelists (mean) vary.
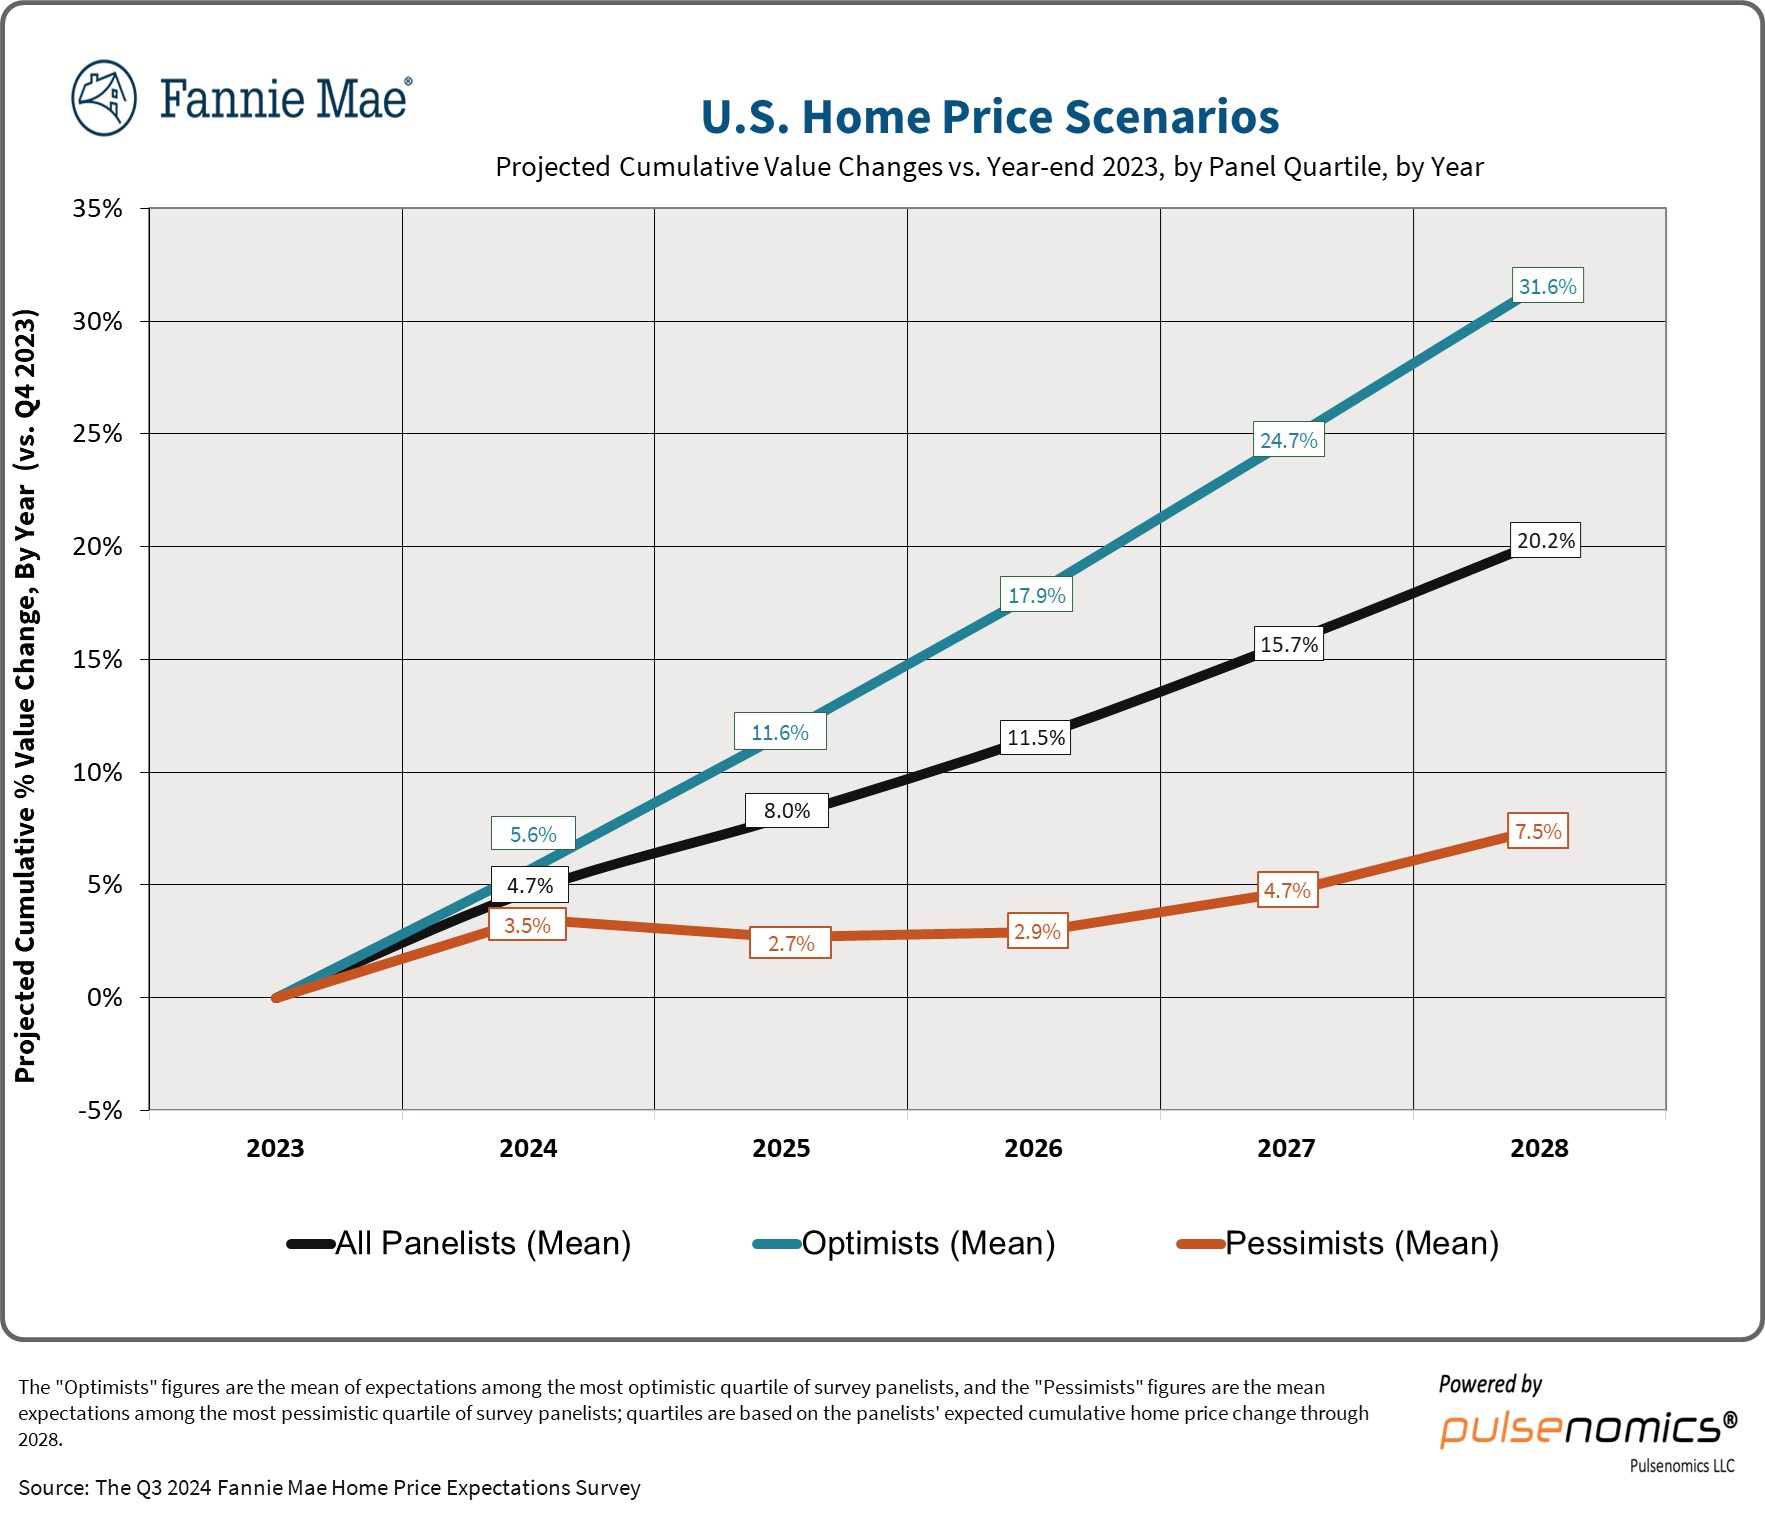
2024: Moderate Home Price Forecast
According to the data, the “All Panelists (Mean)” scenario suggests a 5.6% cumulative increase in home prices by the end of 2024. This relatively modest growth reflects the balanced perspectives of industry experts, who anticipate a more measured pace of price appreciation compared to recent years. In contrast, the “Optimists (Mean)” scenario paints a more bullish picture, projecting an 11.6% cumulative increase, while the “Pessimists (Mean)” scenario foresees a 4.7% rise.
2025: Diverging Projections
As we move into 2025, the projections begin to diverge more significantly. The “All Panelists (Mean)” scenario points to an 8.0% cumulative increase, but the “Optimists (Mean)” forecast a more robust 17.9% gain. Conversely, the “Pessimists (Mean)” envision a more modest 2.7% rise, potentially signaling a cooling of the market.
2026: Widening Gap
By 2026, the differences in home price projections become even more pronounced. The “All Panelists (Mean)” scenario suggests an 11.5% cumulative increase, while the “Optimists (Mean)” foresee a substantial 24.7% rise. The “Pessimists (Mean),” on the other hand, expect a mere 2.9% gain, hinting at a potential market correction.
2027: Continued Divergence
Moving into 2027, the disparity in projections continues to widen. The “All Panelists (Mean)” scenario points to a 15.7% cumulative increase, the “Optimists (Mean)” envision a robust 31.6% rise, and the “Pessimists (Mean)” anticipate a more modest 4.7% gain.
2028: Persistent Variations
As we look out to 2028, the contrasting perspectives on the future of home prices remain evident. The “All Panelists (Mean)” scenario projects a 20.2% cumulative increase, the “Optimists (Mean)” maintain their 31.6% forecast, and the “Pessimists (Mean)” foresee a 7.5% rise.
U.S. Home Prices: From Pre-Bubble Boom to COVID Reshuffling
Looking at the third chart which showcases U.S. Home Prices – Average Annual Growth Rates, we can see the historical trends and the experts' expected average annual growth rates for the coming years. The chart includes data from the “Pre-Bubble”, “Bubble”, “Bust”, “Post-Bust Recovery”, and the “Covid Reshuffling” periods. The historical data shows that the average annual growth has varied dramatically.
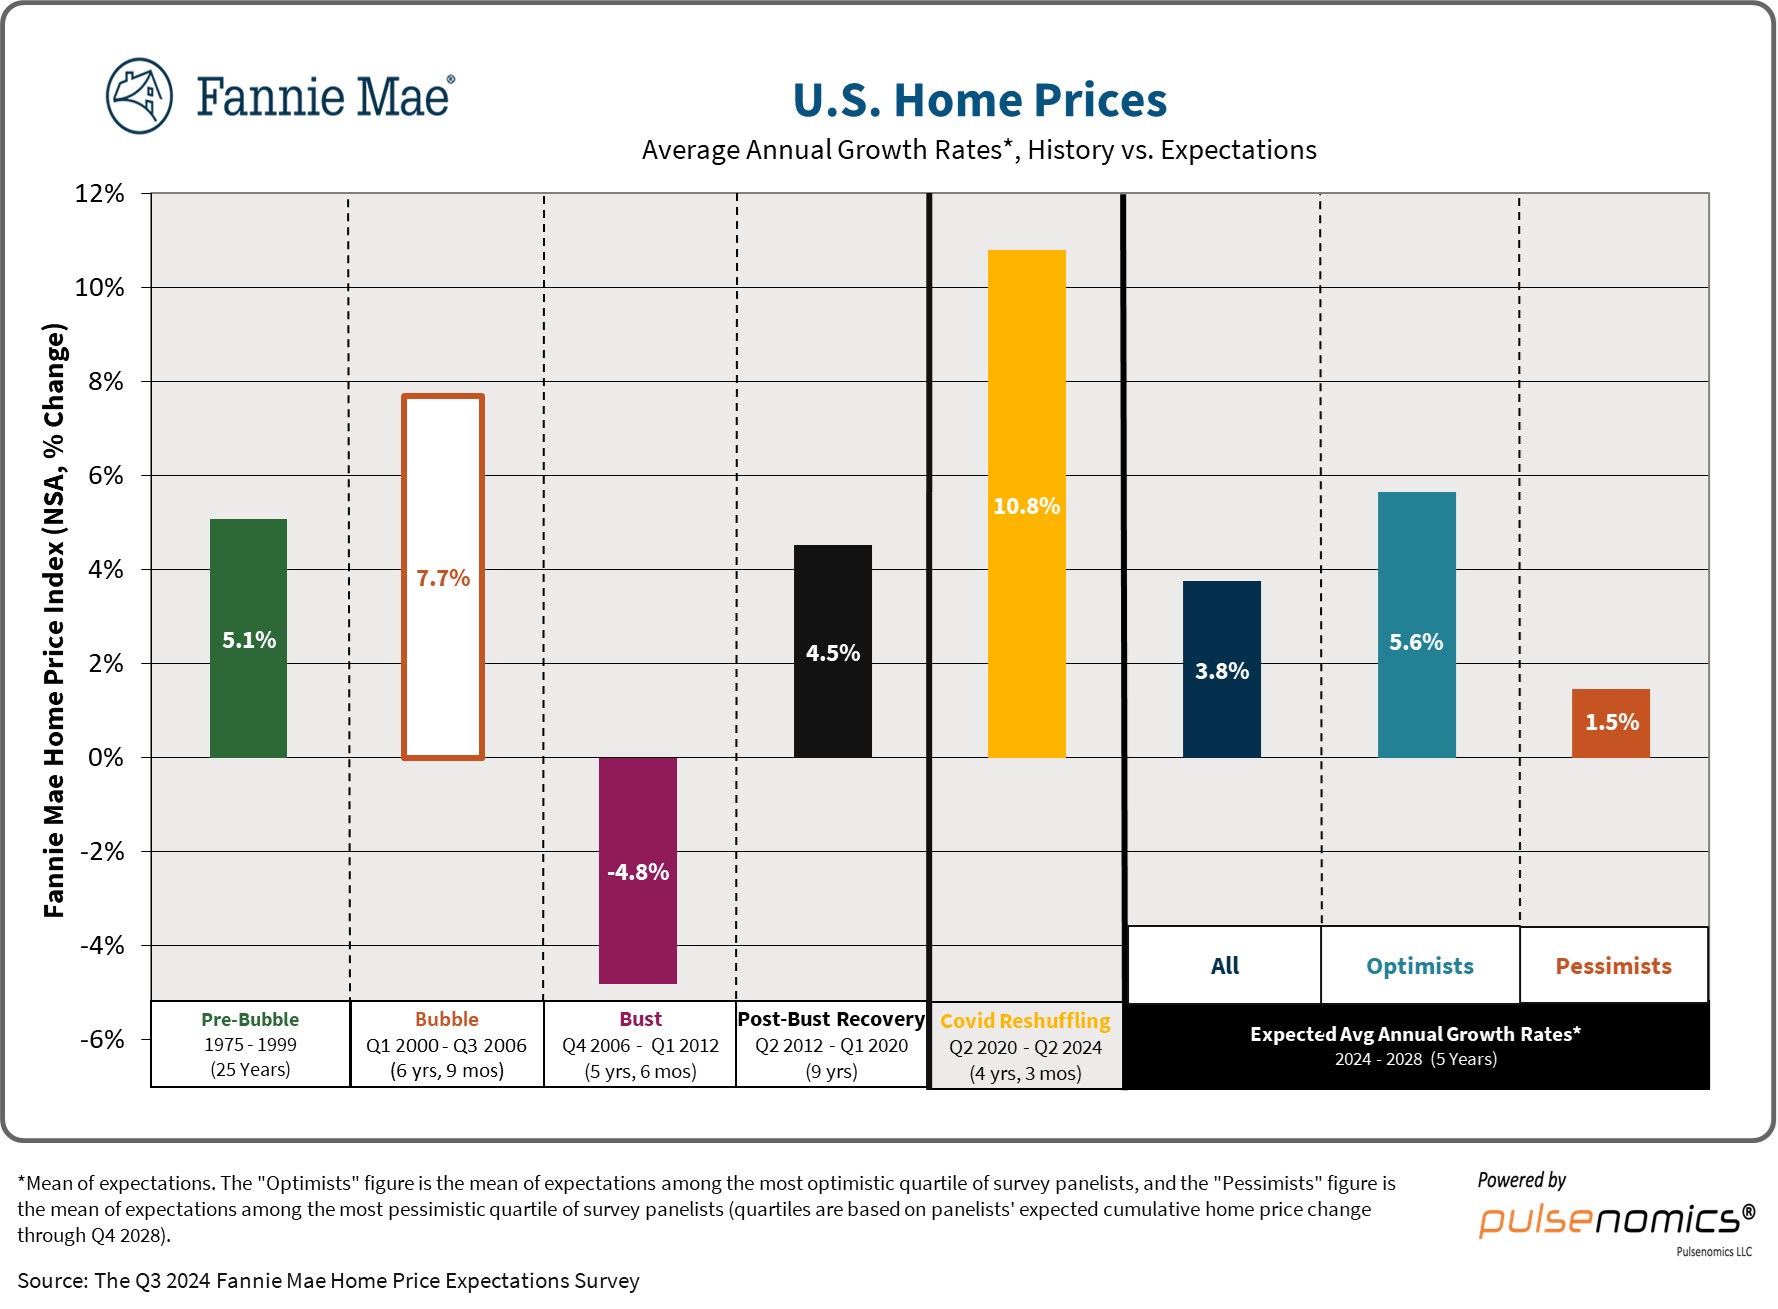
- During the Pre-Bubble era (1975-1999), the average annual home price growth was a healthy 5.1%.
- The Bubble period (2000-2005) saw a surge in growth, peaking at 7.7%.
- Unfortunately, this was followed by the Bust (2006-2011), where average annual growth actually fell to -4.8%.
- The Post-Bust Recovery (2012-2020) was a slow climb back up, with an average of 4.5% annual growth.
- And the Covid Reshuffling period (2020-2024) saw a significant jump in growth, achieving 10.8%.
According to the experts, the expected average annual growth rates for the next few years are expected to be more modest:
- All Panels: 3.8%
- Optimists: 5.6%
- Pessimists: 1.5%
Average Annual Home Price Growth: Tracing the Trajectory
The fourth chart, which focuses on Average Annual Home Price Growth Expectations by Survey Edition, shows that the experts' expectations for the average annual home price growth have fluctuated over the years. I've noted that the expectations have fluctuated, and it's important to distinguish between the actual home price growth we've experienced and the predictions experts have made throughout the years.
If you look at the black line which is the panel mean, you can see that the expectations for growth peaked in 2017 and then fell, dropping below 4% in 2023.
The chart displays the average annual home price growth projections from Q1 2010 through Q4 2024. This comprehensive data set provides valuable insights into the evolving perspectives on the U.S. housing market over the past 14 years.
Beginning in 2010, the chart shows the “All Panelists (Mean)” scenario fluctuating between positive and negative territory, reflecting the volatility and recovery of the post-recession housing market. The “Optimists (Mean)” and “Pessimists (Mean)” scenarios also exhibit a wide range of divergent expectations during this period.

As we move closer to the present day, the projections start to converge, with the “All Panelists (Mean)” reaching a projected 5.6% annual growth in Q4 2024. The “Optimists (Mean)” foresee an 8.0% annual increase, while the “Pessimists (Mean)” anticipate a more modest 1.5% growth.
Factors Driving These Projections & Forecasts
The Housing Supply Squeeze
One of the key factors contributing to this anticipated slowdown in home price growth and continuing affordability challenges is the persistent shortage of housing. The panel overwhelmingly agrees that the U.S. has a significant housing shortage — they estimate that we're short approximately 2.8 million homes. This figure is slightly lower than the previous estimate of more than 4 million, which tells you that the market has shifted a little.
The housing supply constraint remains a major issue, impacting affordability and limiting housing options for potential buyers.
Policy Changes and Potential Impacts
Interestingly, the survey also focused on the potential impact of policy changes, including zoning reforms, permitting reforms, and increasing density around transit areas. The survey wanted to find out what experts think of the likely impacts that reforms at the local and state levels could have on the supply of housing.
The experts generally agree that these reforms could have a positive effect on new construction, but there's a lot of disagreement on how strong the impact will be.
Here's a breakdown of the panel's opinions:
- Hastening the construction permitting process: This was seen as having the greatest positive impact if implemented broadly.
- Expanding zoning for multifamily housing: Another reform that could contribute to increased supply.
- Enabling more “missing middle” or “light touch density” housing: This option could also be a positive move.
However, a significant proportion of panelists (63%) are “not confident at all” that these initiatives will be adopted on a large enough scale to make a meaningful difference in housing supply. This expresses a bit of realism and a cautious view of the political realities that would be needed to get these kinds of reforms passed.
These insights are crucial for understanding the challenges and potential solutions to the ongoing housing supply issues. While policy reforms have the potential to boost housing production and increase supply, the lack of widespread confidence in their adoption highlights the barriers to addressing the housing crisis.
What Does This Mean for the Future?
So, what does all of this mean for the housing market in the next four years?
For Buyers:
- Expect a slowdown in price appreciation. While prices are likely to continue to rise, they are expected to do so at a more moderate pace than we've seen recently.
- Affordability will remain a challenge. The housing shortage will continue to put upward pressure on prices, even with slower growth.
- Competition might ease slightly. As price growth slows and interest rates stabilize, some buyers might find it easier to enter the market.
- Interest rates are likely to play a large role. While the Federal Reserve has been working to manage inflation, they still have a large impact on the housing market.
For Sellers:
- Home price appreciation will slow. Don't expect the same dramatic price increases we've seen in the past few years.
- Inventory might increase slightly. As interest rates stabilize and prices moderate, some homeowners might decide to list their properties.
- The market might become more balanced. It's not likely to become a buyer's market, but the days of huge bidding wars and incredibly fast sales may be over.
- Understanding the market trends will be crucial. Timing the market can be difficult, but by staying on top of the trends, sellers can make informed decisions.
For Investors:
- Returns might moderate. While the market is expected to continue to grow, the rate of return might be lower than in recent years.
- Rental demand is likely to remain high. The shortage of housing is also impacting the rental market, creating a strong demand for rental properties.
- Focus on value and location. Investors might want to choose properties that offer a good value for the price.
- Diversification will be important. Don't put all of your eggs in one basket.
The Bottom Line
The housing market is expected to transition into a period of slower growth in the coming years. While home prices are projected to continue rising, the rate of increase will likely be more gradual. The housing supply shortage will remain a key challenge, continuing to affect affordability and competition in the market.
Policy changes related to zoning, permitting, and density could help to address the housing supply crisis, but there's considerable uncertainty about their widespread adoption and effectiveness. Interest rates are likely to play an important role in the future of the market as well.
As outlined in the survey and supported by credible resources, including Fannie Mae's detailed reports on their website Fannie Mae Home Price Expectations Survey, the next few years will unveil the complexities and shifts within the housing market.
Work with Norada, Your Trusted Source for
Turnkey Investment Properties
Discover high-quality, ready-to-rent properties designed to deliver consistent returns. Contact us today to expand your real estate portfolio with confidence.
Reach out to our investment counselors:
(949) 218-6668 | (800) 611-3060
Recommended Read:
- Housing Market Forecast for the Next 2 Years: 2024-2026
- Housing Market Predictions for Next Year: Prices to Rise by 4.4%
- Housing Market Predictions for 2025 and 2026 by NAR Chief
- Real Estate Forecast Next 5 Years: Top 5 Predictions for Future
- Is the Housing Market on the Brink in 2024: Crash or Boom?
- 2008 Forecaster Warns: Housing Market 2024 Needs This to Survive
- Real Estate Forecast Next 10 Years: Will Prices Skyrocket?
- Housing Market Predictions for Next 5 Years (2024-2028)
- Housing Market Predictions 2024: Will Real Estate Crash?
- Housing Market Predictions: 8 of Next 10 Years Poised for Gains
- Trump vs Harris: Which Candidate Holds the Key to the Housing Market (Prediction)
