One of the key indicators shedding light on the housing market is the US CoreLogic S&P Case-Shiller Index. The latest Case-Shiller Index highlights continued headwinds for the housing market such as affordability challenges for potential homebuyers.
At the onset of 2024, a slight dip in mortgage rates provided a glimmer of hope for the housing sector, offering a reprieve from the winter stagnation experienced in the previous year. This drop sparked optimism among investors, fueling expectations for a robust spring homebuying season.
However, as the year progressed, mortgage rates began their ascent once again, dampening the initial enthusiasm. Despite this setback, signs of a thaw in the housing market emerged, particularly evident in the uptick of existing for-sale inventory. The surge in new listings presents both opportunities and challenges for prospective homebuyers, offering a broader selection while potentially curbing the steep price surges witnessed in 2023.
Steady Growth in Home Prices
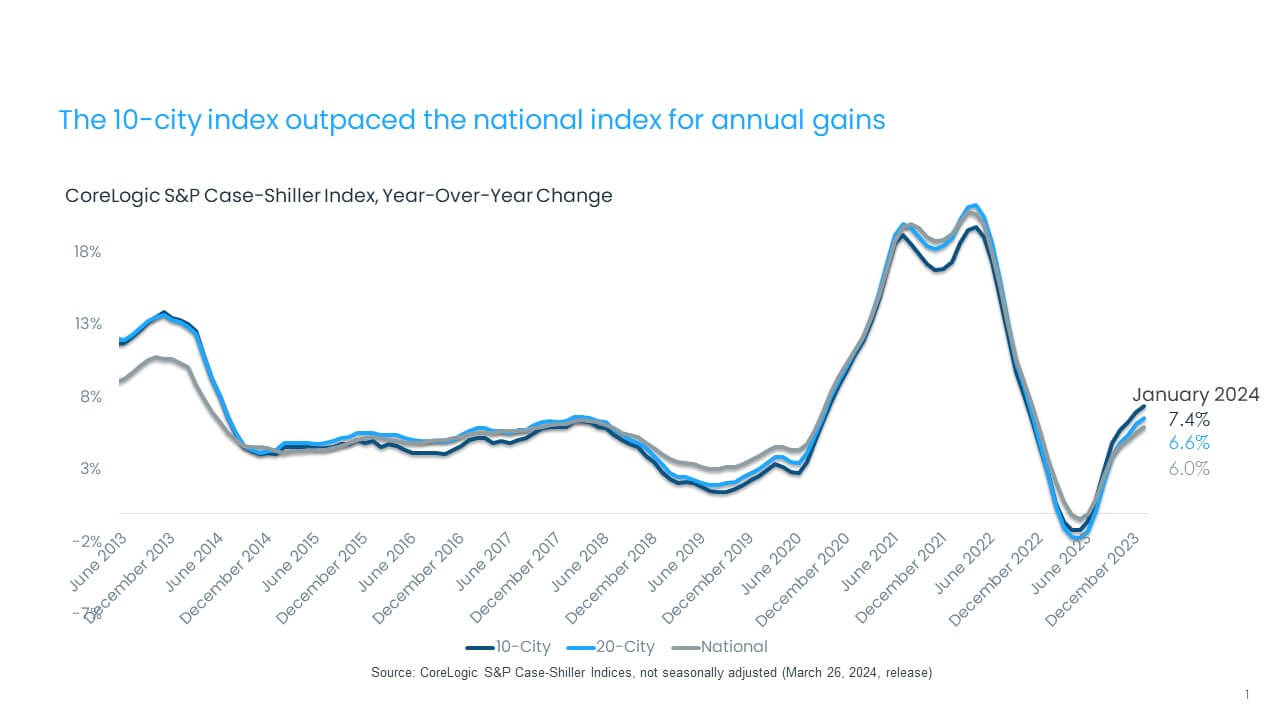
January marked a significant milestone in the real estate landscape, with the CoreLogic S&P Case-Shiller Index recording a 6% year-over-year increase. This uptick, the seventh consecutive monthly rise, signifies a resurgence in home prices following a brief period of decline.
Compared to the lows experienced in January 2023, home prices have rebounded impressively, climbing 6% from the bottom and 1% from the peak witnessed in June 2022. Despite the challenges posed by fluctuating mortgage rates, the market continues its upward trajectory, albeit at a slightly tempered pace.
Regional Variances and Market Dynamics
Delving deeper into the data, we observe variations across different regions and metro areas. The 10-city and 20-city composite indexes paint a picture of resilience, with both indices posting annual increases of 7.4% and 6.6% respectively.
Notably, metros like New York and Chicago stand out for their robust performance, reflecting the resurgence in urban housing markets as the return to cities gains momentum. These areas are witnessing a catch-up phase, striving to match the price gains experienced by pandemic-era boomtowns during the height of the COVID-19 pandemic.
Regional Trends in Home Price Appreciation
Among the top 100 largest metro areas, a notable trend emerges in the Northeast, with the highest rates of home price appreciation this year clustered around New York City's vicinity. Camden, New Jersey, and Hartford, Connecticut, both experienced a remarkable 13% surge in home prices, closely followed by Newark, New Jersey, with an 11% increase.
Comparing current figures with the 2006 peak, the resilience of the housing market becomes evident. The 10-city composite index stands 47% higher, while the 20-city composite index exhibits a 54% increase. Adjusted for inflation, the 10-city index now surpasses its 2006 level by 1%, while the 20-city index boasts a 5% rise. Nationally, home prices, adjusted for inflation, sit 15% higher than they did in 2006.
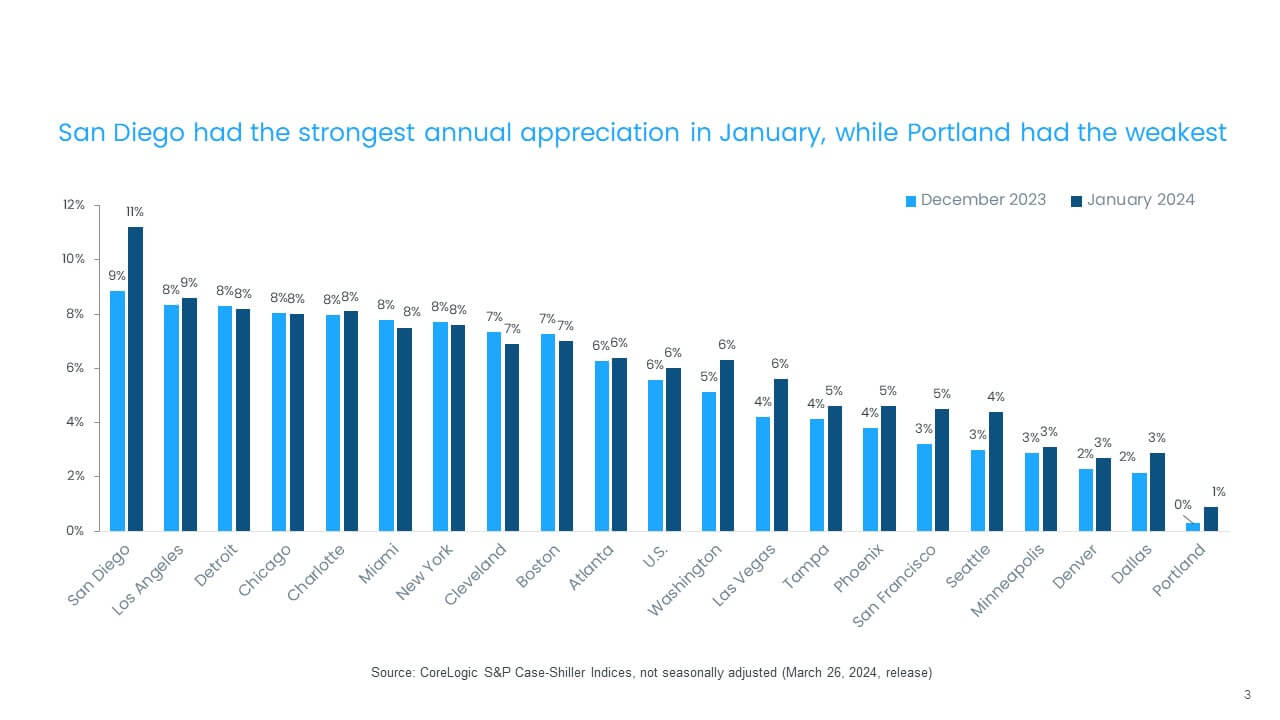
In January, 14 metros witnessed accelerated price growth compared to the previous month, a trend influenced by the comparison with the home price bottom in January 2023. San Diego, Los Angeles, and Detroit lead the 20-city index, boasting respective annual gains of 11.2%, 8.6%, and 8.2%. Eleven metros outpaced the national 6% increase in home prices.
Notably, the Western U.S. exhibits robust annual price acceleration, particularly in San Diego, Seattle, San Francisco, and Las Vegas. Conversely, Cleveland, Boston, and Miami reported a slowdown in appreciation in January, while Portland, Oregon, saw the slowest rate of home price gains, up by 1% compared to January 2023.
Monthly Variations and Regional Dynamics
While national home prices experienced a slight decline of 0.1% from December to January, regional disparities persist. San Diego and Washington led the nation with the largest monthly gains, registering 1.8% and 0.5%, respectively. Meanwhile, metros in the Midwest, including Cleveland, Detroit, Minneapolis, and Chicago, cooled off in January after showing strength in previous months.
The Midwest, characterized by more affordable housing options, grapples with affordability challenges as mortgage rates remain elevated. Although all metros except for San Diego, Washington, and Los Angeles posted monthly declines, the declines were more pronounced in Cleveland and Denver in January compared to pre-pandemic trends.
Implications and Outlook
The S&P CoreLogic Case-Shiller Index underscores both resilience and challenges in the housing market. While surging borrowing costs present headwinds, improved availability of new listings offers a glimmer of hope for prospective homebuyers. However, affordability concerns persist, especially in regions experiencing slowing price gains, signaling a need for innovative solutions to ensure sustainable growth in the real estate sector.
As we navigate the complexities of the housing market, staying informed and adaptable is crucial. By leveraging insights from indices like the S&P CoreLogic Case-Shiller Index, investors and homeowners alike can make informed decisions. The forecast for the year indicates a modest growth rate, with the CoreLogic Home Price Index projecting gains averaging approximately 3.2%.
