Before we zoom in on the high-risk zones, let's get a feel for the bigger picture. Nationally, the housing market is in a weird spot. After years of absolutely breakneck growth fueled by historically low interest rates and pandemic-driven demand, things have certainly slowed down.
According to recent data, the national median home price actually hit a new high in February, reaching $385,000. That might sound bullish, but as Cotality's Chief Economist Selma Hepp pointed out, this rise was more of a seasonal bump and felt “subdued compared to pre-pandemic levels.” The annual appreciation rate is cooling.
Why the slowdown? Several factors are at play:
- Affordability is Stretched Thin: This is a big one. The income needed to comfortably afford that median-priced home is now around $85,600. That's a whopping 22% higher than the average national wage! When people simply can't afford homes, demand naturally weakens. I see this constantly – buyers are qualified for less, or they're priced out entirely.
- Economic Uncertainty: People are worried. Concerns about potential inflation (maybe driven by things like tariffs), whispers of job losses, and general unease about personal finances make big commitments like buying a house feel riskier. This “wait and see” attitude definitely dampens homebuying demand.
- Interest Rates: While not explicitly detailed in the latest snippet, we all know mortgage rates have bounced around, staying significantly higher than the rock-bottom rates of 2020-2021. Higher rates directly impact monthly payments and buying power.
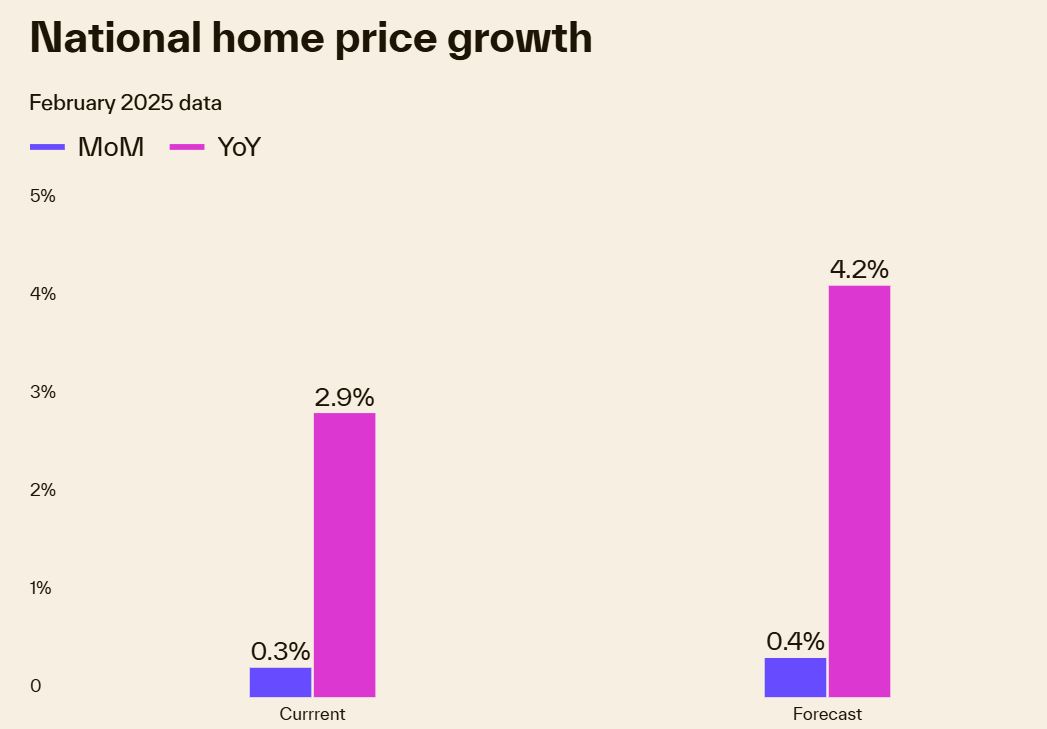
Despite these headwinds, the market isn't collapsing nationwide. The forecast still predicts year-over-year price growth, albeit at a more moderate pace (around +4.2% forecast from Feb 2025 to Feb 2026, compared to the current +2.9% YoY). This suggests a return to more normal, long-term average growth rather than a widespread crash.
However, real estate is intensely local. National averages smooth out the dramatic differences we see from state to state, and even city to city.
Why Some Markets Heat Up While Others Cool Down
It's fascinating to see the regional differences right now. Selma Hepp highlighted a key trend: the Northeast is still seeing strong price gains. Why? Primarily due to stronger income growth in that region combined with a severe, ongoing shortage of homes for sale. Basic supply and demand – lots of buyers competing for very few homes keeps prices high. Markets like Bridgeport, CT (+10.93%), Syracuse, NY (+9.33%), and New Haven, CT (+8.8%) are topping the “hottest markets” list.
On the flip side, areas in the Southeast and West are showing more signs of cooling. These regions often saw explosive growth during the pandemic boom. Now, they're experiencing more inventory growth (more homes hitting the market) and weakening demand. This leads to more sellers having to offer price discounts.
Florida is a prime example of this cooling trend. Several Florida cities dominate the “coolest markets” list, showing actual year-over-year price declines:
- Cape Coral, FL: -4.5%
- Sarasota, FL: -4.2%
- Daytona, FL: -1.8%
- Winter Haven, FL: -1%
- Palm Bay, FL: -0.6%
- Tampa, FL: -0.6%
Selma Hepp specifically mentioned that condominium prices have slowed, particularly as condo inventory in Florida continues to increase rapidly. This glut of supply, especially in certain segments, puts downward pressure on prices. From my perspective, this signals that the pandemic-era rush to sunshine states might be normalizing, and supply is finally starting to catch up, or even overshoot demand in some places.
Another interesting observation is the rise of places like Tennessee and South Carolina as retirement destinations. With median home prices around $335k and $332k respectively (still below the national median), they're attracting retirees looking for affordability, particularly those priced out of Florida. This influx, as noted, could change the character and affordability of these historically less expensive markets. It's a reminder that demographic shifts play a huge role in local housing trends.
Deep Dive: 5 Housing Markets with a Very High Risk of Price Crash
Now, let's focus on the specific markets flagged by CoreLogic/Cotality as having a “very high risk” of price decline. It's important to understand what “high risk” means in this context. It doesn't automatically guarantee a massive crash like 2008. Instead, it indicates a significantly higher probability of seeing prices fall compared to the national average or lower-risk areas. This could manifest as a mild correction (say, 5-10% drop) or potentially something more substantial, depending on local economic factors and how significantly the market overheated.
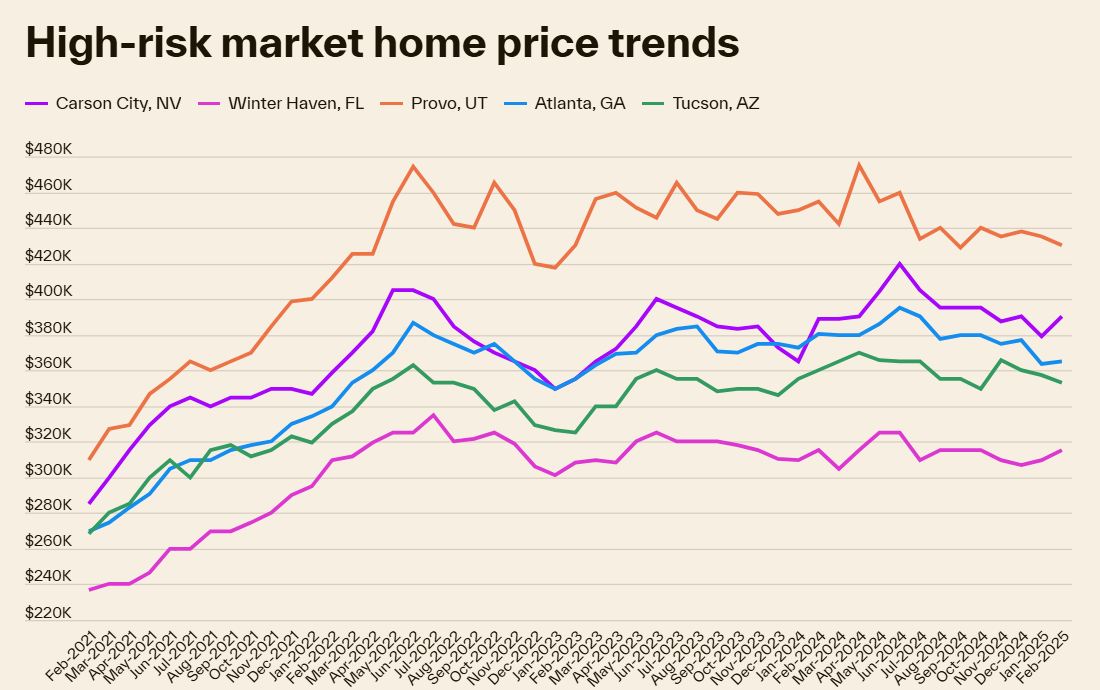
Looking at the price trend graph provided for these five markets, a common pattern emerges: a sharp run-up in prices peaking sometime between early 2022 and mid-2024, followed by a noticeable plateau or downward drift. This visual story often points towards markets that experienced rapid appreciation, potentially becoming overvalued relative to local incomes, and are now facing a correction as demand cools and affordability bites.
Let's examine each one:
1. Carson City, NV
- The Situation: Nevada's state capital saw significant price increases, likely benefiting from spillover demand from more expensive West Coast markets and its own appeal.
- Price Trend Graph: The graph shows Carson City prices peaking around mid-2022 near the $400k mark, dipping, recovering somewhat through 2023, but then showing a distinct downward trend starting in mid-to-late 2024 and continuing into early 2025, settling below $380k.
- My Take: Carson City's trajectory looks like a classic case of a smaller market getting caught up in a regional boom. Its peak coincided with the broader market frenzy. The subsequent decline suggests that the fundamentals (local wages, sustainable demand) might not fully support those peak prices, especially as higher interest rates impact affordability. Its proximity to California means it's sensitive to economic shifts there as well. The risk here seems tied to the potential unsustainability of its rapid price climb.
2. Winter Haven, FL
- The Situation: Located in Central Florida between Tampa and Orlando, Winter Haven likely benefited from the massive influx into Florida seeking affordability relative to the coastal areas.
- Price Trend Graph: Winter Haven's price journey shows a steady climb from early 2021, peaking later than Carson City, around early 2024 above $320k. However, a noticeable decline started shortly after, bringing prices down towards the $310k mark by early 2025. It's also already listed on the “coolest markets” with a -1% YoY change.
- My Take: This aligns perfectly with the broader Florida cooling trend mentioned earlier, especially regarding rising inventory. Winter Haven was likely a destination for those priced out of larger Florida metros. As demand statewide cools and inventory (perhaps including those condos Selma Hepp mentioned) builds, markets like Winter Haven, which saw rapid appreciation, become vulnerable. The fact it's already showing negative year-over-year growth reinforces its position on this high-risk list. I suspect rising insurance costs in Florida might also be starting to weigh on buyer sentiment and affordability here.
3. Provo, UT
- The Situation: The Provo-Orem area is known for its strong tech presence (“Silicon Slopes”) and younger demographic, factors that fueled incredible housing demand and price growth.
- Price Trend Graph: Provo shows one of the most dramatic peaks on the graph, soaring well above $460k in early-to-mid 2022. The correction was equally sharp initially, followed by some volatility, but the overall trend since the peak has been downward, sitting closer to $420k by early 2025.
- Price Trend Analysis: Provo's boom was intense. Such rapid growth often outpaces wage growth, creating an affordability crunch even with a strong local economy. The tech sector has also seen some volatility nationally, which could indirectly impact sentiment and high-end demand in Provo. The significant drop from its peak suggests the market was clearly overvalued, and the ongoing downward drift indicates the correction might not be over. This looks like a market needing to find a more sustainable price level.
4. Atlanta, GA
- The Situation: Atlanta has been a major hub for growth, attracting businesses and residents alike, leading to substantial housing demand.
- Price Trend Graph: Atlanta's price trend shows strong growth through 2021 and 2022, peaking around $380k-$390k in mid-2022. Since then, it's been more of a bumpy plateau with a slight downward tilt, particularly noticeable from late 2023 into early 2025, ending near the $360k mark.
- Price Trend Analysis: Atlanta's risk profile might be slightly different. While it saw strong growth, its peak wasn't quite as sharp or its immediate drop as dramatic as Provo's. However, the persistent inability to regain its peak and the recent downward drift suggest weakening demand relative to supply. Factors could include affordability challenges creeping into this major metro and potentially slowing in-migration compared to the peak pandemic years. It feels like a market transitioning from hot growth to a cooling phase, making it vulnerable to price dips if economic headwinds pick up. My feeling is that affordability constraints are really starting to bite here.
5. Tucson, AZ
- The Situation: Like many Sun Belt cities, Tucson experienced a surge in popularity and home prices, attracting buyers seeking sunshine and relatively lower costs compared to California or even Phoenix.
- Price Trend Graph: Tucson's graph shows a steady climb, peaking later than some others, around early 2024, near $370k. Similar to Winter Haven, the decline started relatively recently but appears consistent, bringing prices down towards $350k by early 2025.
- Price Trend Analysis: Tucson's recent peak and subsequent decline suggest the tail end of the boom might have pushed prices beyond what the local market can sustain long-term. As affordability pressures mount nationally and migration patterns potentially shift again, markets like Tucson that saw rapid, recent appreciation become prime candidates for a correction. The risk here feels tied to the possibility that the recent price levels were driven more by temporary pandemic-era demand shifts than by underlying long-term economic fundamentals. It’s a market to watch closely to see if this downward trend accelerates.
What Does “High Risk” Really Mean for You?
Hearing “high risk of price crash” can be scary, especially if you own a home in one of these areas or are considering buying there. Let's put it in perspective:
- Correction vs. Crash: A correction typically involves a price decline of around 10%, maybe up to 20% in some cases. It's a market resetting after a period of being overvalued. A crash, like we saw after 2007, involves much steeper, faster declines (20%+) often accompanied by widespread foreclosures and economic distress. While these 5 markets have a higher risk of decline, most economists aren't forecasting a 2008-style crash across the board. The lending standards today are much stricter than they were back then.
- It's About Probability: This list identifies markets where the chances of prices falling are higher than elsewhere. It's not a guarantee. Local economic developments, shifts in inventory, or changes in interest rates could alter the trajectory.
- Focus on the Long Term: If you bought a home recently at peak prices in one of these areas, seeing values dip isn't fun. But if you plan to live there for many years (say, 7-10+), housing markets tend to recover and appreciate over the long haul. Short-term fluctuations matter most if you need to sell soon.
- Opportunity for Buyers? For potential buyers, falling prices can be an opportunity if you have stable finances and plan to stay put. However, trying to perfectly “time the bottom” is notoriously difficult and risky. Buying a home you can comfortably afford in a location you love is always the best strategy.
Factors I'm Watching Closely (Beyond These 5 Markets)
Whether you're in a high-risk zone or not, here are the key indicators I always keep an eye on to gauge market health:
- Inventory Levels: Are more homes hitting the market (rising inventory)? Are they selling quickly, or sitting longer? A sustained rise in inventory, especially if sales slow, points to potential price drops. The data showing rising condo inventory in Florida is a perfect example.
- Days on Market (DOM): How long does it take for a home to go under contract? If DOM starts stretching out significantly, it means buyers are becoming more hesitant or have more options.
- Price Reductions: Are sellers increasingly having to lower their asking price to attract offers? Tracking the percentage of listings with price cuts is a great real-time indicator of market softness. The data mentioned more price discounts in the Southeast and West – a clear sign of cooling.
- Mortgage Rates: Even small changes impact affordability. Keep an eye on the general trend. Sustained higher rates will continue to pressure demand.
- Local Job Market: A strong local economy supports housing demand. Conversely, significant local layoffs can quickly cool a housing market.
Looking at the “Coolest Markets” list again – Cape Coral, Sarasota, San Francisco, Daytona, Winter Haven, Austin, Dallas, Palm Bay, Tampa, Oakland – it reinforces that the cooling isn't isolated to just the 5 “highest risk” areas. Many markets, particularly former pandemic boomtowns in Florida and Texas, along with expensive coastal areas like California, are already experiencing mild price declines.
My Final Thoughts
The US housing market is definitely navigating a complex transition. The days of easy double-digit annual gains are likely behind us for most areas. While a nationwide crash seems unlikely due to stricter lending and ongoing supply shortages in many regions, the risk of price declines is very real in specific, overheated markets.
The identification of Carson City, Winter Haven, Provo, Atlanta, and Tucson as the 5 housing markets with a very high risk of price crash serves as a crucial warning sign. These markets appear to share common threads: rapid price appreciation during the boom, potential overvaluation relative to local incomes, and now signs of cooling demand or rising inventory as affordability bites and pandemic-era trends normalize.
My advice? If you're in one of these markets, or frankly anywhere, stay informed about your local conditions. National headlines provide context, but real estate is hyperlocal. Pay attention to inventory, days on market, and price reductions in your specific neighborhood. If you're buying, ensure you're purchasing a home you can truly afford for the long haul, not speculating on short-term gains. If you're selling, be realistic about pricing based on current market conditions.
The housing market requires a more cautious and informed approach today than it did two years ago. Understanding the risks, especially in identified hotspots, is the first step toward making smart decisions.
Work with Norada, Your Trusted Source for
Real Estate Investment in the Top U.S. Markets
Discover high-quality, ready-to-rent properties designed to deliver consistent returns.
Contact us today to expand your real estate portfolio with confidence.
Contact our investment counselors (No Obligation):
(800) 611-3060
Also Read:
- Housing Markets Predicted to Crash by Double Digits by Q1 2026
- Real Estate Forecast: Will Home Prices Bottom Out in 2025?
- Housing Markets With the Biggest Decline in Home Prices Since 2024
- Why Real Estate Can Thrive During Tariffs Led Economic Uncertainty
- Rise of AI-Powered Hyperlocal Real Estate Marketing in 2025
- Real Estate Forecast Next 5 Years: Top 5 Predictions for Future
- 5 Hottest Real Estate Markets for Buyers & Investors in 2025
- Will Real Estate Rebound in 2025: Top Predictions by Experts
- Recession in Real Estate: Smart Ways to Profit in a Down Market
- Will There Be a Real Estate Recession in 2025: A Forecast
- Will the Housing Market Crash Due to Looming Recession in 2025?
- 4 States Facing the Major Housing Market Crash or Correction
- New Tariffs Could Trigger Housing Market Slowdown in 2025
- Real Estate Forecast Next 10 Years: Will Prices Skyrocket?


